Science is Vital’s letter in the Telegraph today challenges the government to set itself the target of investing at least 0.8% of GDP in science. Where does this number come from, and what does it mean?
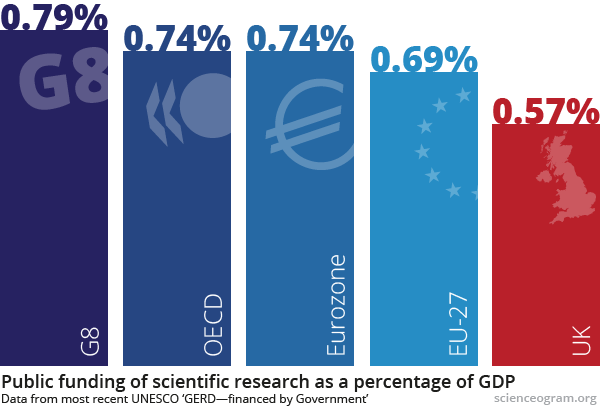
Research funding in the UK is in a state of managed decline. This is in marked contrast to the many countries worldwide that have decided to invest in science, in order to stoke growth and fuel economic recovery. Our letter challenges the government to set a target for public investment in science of at least 0.8% of GDP; this benchmark was chosen because it’s the average governmental expenditure on research and development across the G8.
However, it doesn’t really matter with whom you choose to compare the UK: British public investment in science is below average globally. Using UN data for the amount spent by governments on research and development as a fraction of GDP, let’s find out how the UK stacks up.
The UK government’s poor performance relative to these international averages has been consistent since at least 1996, when this dataset begins (and before the eurozone even existed!). It will be interesting to see how this situation changes as the latest data trickle in, but by then it will be too late for many young scientists whose future careers depend on sustained funding now.
The UK government is cutting funding via a convoluted set of changes to science spending, including redefining what is included in the ringfenced ‘science budget’. This has ultimately resulted in reductions in capital spending, and smaller research budgets for a number of departments.
Investing an extra 0.1% of GDP in science would cost us about £1.5bn per year (which is pretty small fry in a government budget of nearly £700bn), so keeping up with—or even exceeding—the G8 average wouldn’t be too expensive. And it’s wrong to think of this as a simple expense anyway: money spent on science is an investment with the potential to solve some of the biggest technological, social and economic challenges facing society. Whether looking for treatments for the deadliest diseases, or seeking cheaper, greener energy, science and engineering provide the potential for large social and economic returns on a small initial investment.
So, join with 53 Nobel laureates and eminent scientists, share the letter on Facebook, or Twitter, and be part of the debate about the future of UK science.
This post is reproduced on Scienceogram UK, a new website making the case for more science funding by making sense of the stats.
Data sources
The UN publishes a range of statistics on scientific research and development on its online Data Centre. We used the most recent values of ‘GERD financed by Government’ (GERD = Gross Expenditure on Research and Development) to work out where nations sit relative to one another on an internationally uniform scale.
It’s worth noting that, whilst these are the latest figures, they’re still patchy over recent years. The UK figure is for 2010, so doesn’t fully reflect the real-terms reduction in science spending since then. Data for most other countries are for 2008–2010. Full data and calculations are available in a spreadsheet produced by scienceogram.org.
Finally, note that while UNESCO make the separation of the ‘source’ of funds and the ‘sector of performance’ obvious, other data sources report in a more confusing fashion. For example, Government Expenditure on R&D (GovERD) refers to R&D performed by government bodies, and doesn’t specify who picked up the bill. Conversely, ‘GERD financed by Government’ (the statistic we used) refers to R&D paid for by the government, irrespective of where it was performed.
Categories: Evidence
It would be great if you could add some information on total R&D (ie including private/voluntary sector) – not that I’m suggesting this will push the UK up the league table, but public R&D can’t be understood in isolation, particularly given the ever more generous R&D tax subsidies.
It would also be good to go some way to breaking out defence R&D. Historically, I understand this was a large proportion of R&D and arguably the most wasteful, and I understand it has been falling proportionately.
I appreciate you’ve picked a simple, eye-catching figure to lead the campaign, but it’s not terribly meaningful on its own, especially since it wouldn’t be hard to recategorise existing expenditure or tax breaks for a (cynical) government to hit a particular target.
Thanks!
Please replace R&D with ‘science funding’ in the above.
Thanks
Hi Tyskie, thanks for your comment.
You’re quite right that you can’t get a full picture of R&D without including the private sector. However, you’re also correct that it doesn’t push the UK up the league table! According to this Telegraph article, UK firms receive less in R&D tax credits etc than anywhere else in the world. This 2011 Treasury report states that they’re worth ‘nearly £1bn’, which is about 0.06% of GDP. You’re also right about defence R&D, and removing this is likely to make the UK look worse! We still spend quite a significant fraction of our public research money on defence (see the Scienceogram page on government spending), likely more than other countries, and this is included in that 0.57%.
The reason we’ve focussed on directly government-funded R&D is because we think that the UK’s relatively small public investment in science is the fundamental problem here. Obviously there are myriad policy issues about how best to spend that money, but it’s easy to get bogged down in those and miss the fact that science, under current spending commitments, will have experienced significant real-terms cuts by 2015. Further, directly-funded R&D is obviously under direct control of government; and private-sector R&D tends to be correlated with it: signalling a commitment through public funding of science encourages businesses to invest.
It also wouldn’t be so easy for a cynical government to play the stats: that’s why we were careful to use statistics compiled in line with OECD guidelines, because that keeps things internationally consistent. There are obviously limitations in trying to assess different nations’ diverse science funding mechanisms with one dataset, and there are undoubtedly sneaky ways to increase the headline figure, but this does provide a level of insurance against that. For full details of the methodology, check out the OECD’s Frascati Manual.
I hope that answers your queries…if there are any others, please let us know!